
Technical trial services
Every plot measured, every result your team can open
Small-plot trials flown by drone and measured plot by plot, and paddock scale trials on growers' own machines, for chemical, seed and fertiliser companies. We run the statistics; your team sees the results in its own portal.
cereal trial36
On this page
On this page
Service 1
Small plot trial drone analytics
Each site is flown with a DJI Mavic 3 Multispectral and every plot is measured. Fly the trial again and the new flight sits beside the first, on the same plot grid, so any metric can be compared flight to flight.
Measured on every plot
- NDVI, NDRE, MSAVI and SAVI
- Canopy cover
- Plant height
- On-row and inter-row values
Statistics
- ANOVA per metric: F, p, CV
- LSD (0.05) and letter groups
- Means or rep by rep
- Flight-to-flight comparison
Delivered
- Private portal access
- Results workbook
- CSV bundle
- Every flight kept with the trial


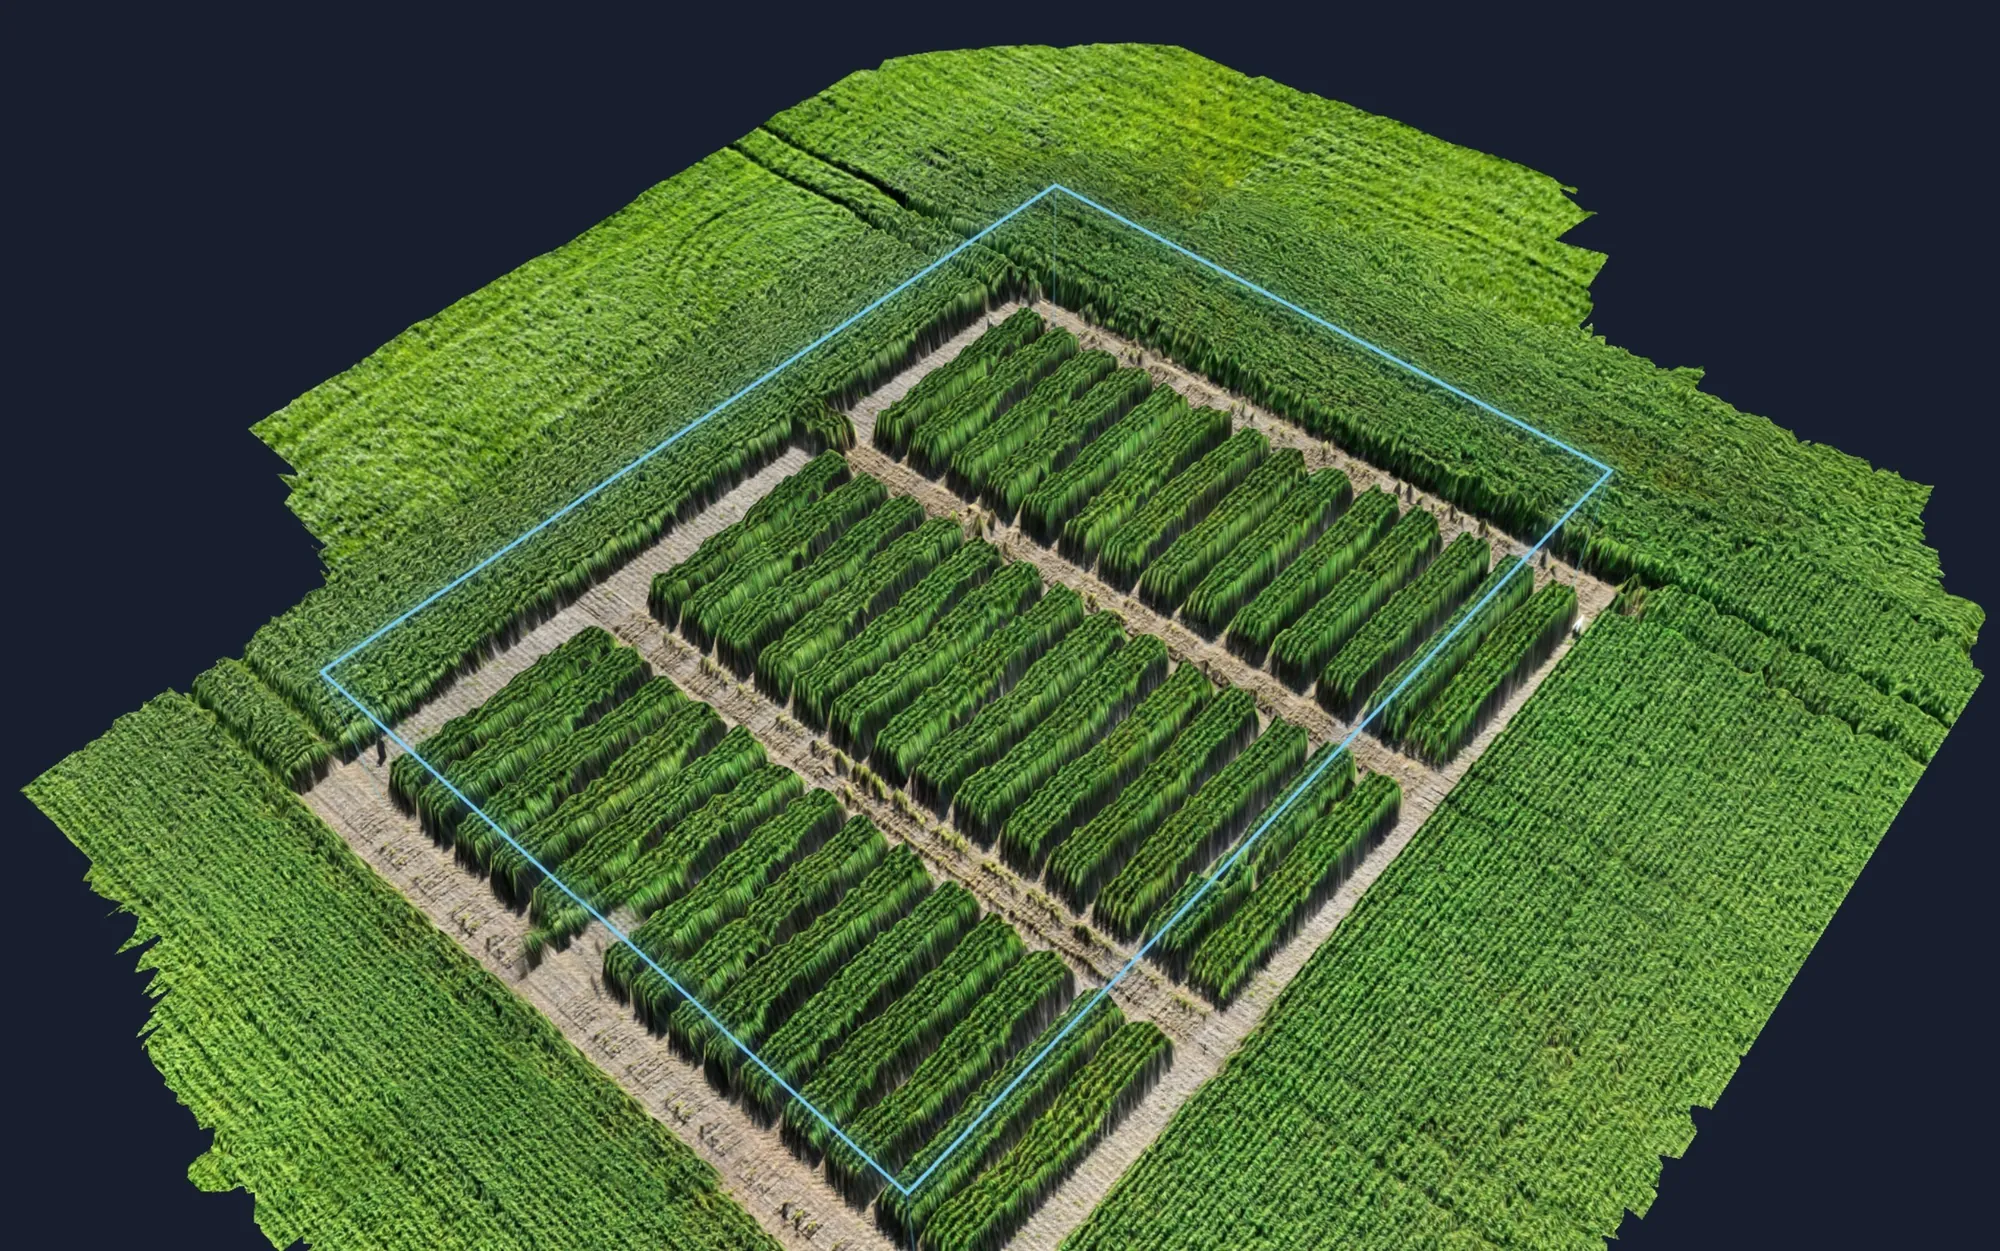
3D terrain
Every flight builds a drone elevation model. The portal drapes the imagery over it, so you can spin and tilt the whole trial and see crop height plot by plot.


Crop row detection
Our in-house AI model finds every crop row in the imagery. Each plot is then split into the crop row and the ground between the rows, so crop growth and weed pressure are measured separately. It works at any row spacing, on any stubble load and in any crop.


Statistics and sharing
One click runs the ANOVA for every metric. Pull the reps apart to check they agree, and click a treatment to light up its plots on the map.


Real trial data. Client and trial names changed.
The Cropix GIS Portal
Small-plot results live at portal.cropixsa.com.au. Every flight is filed under its trial, with the client, season, flight date and plot grid at a glance. Search, filter and open.
Export
A results workbook with bulk data, treatment order and an ANOVA table per metric, or a CSV bundle with plot results and a treatment summary.
Private client access
Share each trial with your organisation. Viewers see the results; editors can also change plot designs. Sign-in is required, and access can be removed at any time.


Service 2
Paddock scale trials
Your product tested on growers' paddocks with their own machines, as long strips or replicated blocks, and measured with yield and protein maps. All sites in a job are reported together.
- Plan
Sites, treatments and rates agreed with you.
- Agree
Each grower's agreement recorded.
- Design
Strips or blocks on the paddock's own run lines.
- Rate files
For each grower's controller, every major brand.
- In season
As-applied check, and satellite or drone NDVI.
- Report
Yield and protein by plot, then a combined report.


Results for every site
- Yield and protein by plot and treatment, with letter groups
- Response to rate: where yield peaks, and the economic optimum
- Plots coloured above or below the control
- Headlands, controller ramp and header flow delay removed
- Report PDF, per-plot CSV and plot map shapefile
- Strips, blocks, factorial and free-form designs
Client portal for paddock scale trials
Your team signs in at app.cropixsa.com.au/trials and sees only the trials shared with your company: the trial list, plot layout, status from designed to analysed, and results.

Status and results
Each site from designed to analysed, then yield, protein and response to rate.
Downloads
Report PDF, per-plot CSV and plot map shapefile for every trial.
Privacy
Growers' names stay hidden unless they agree. "Where am I?" shows your plot on a phone.
Trial prices
| Service | Unit | Rate (ex GST) |
|---|---|---|
| Site feeSite setup, portal access and the first trial on the site. | per site | $1,500.00 |
| Additional trialEach extra trial on the same site. | per trial | $400.00 |
| Drone flightOne flight covers every trial on the site. | per flight | $800.00 + travel |
| Self-supplied imageryNo flight. Your own imagery loaded and analysed. | per site | $400.00 |
| Service | Unit | Rate (ex GST) |
|---|---|---|
| Paddock scale trialSite design, rate files, as-applied check, in-season NDVI, yield and protein analysis, and client portal. | per trial | $6,000.00 |
| Additional passEach extra application pass, for example a second product or timing. | per pass | $1,500.00 |
All prices in Australian dollars, ex GST, current as at October 2026 and subject to change.
Planning a multi-site program?
Send us the product, the number of sites and the passes, and we'll put the season together. Call Matt on 0438 651 622 or email matt@cropixsa.com.au.